When thermal cover performance data lands on a desk, the first instinct is often to reach for a familiar qualification framework. ISTA 7D is rigorous and well-established, governing how temperature control packaging is validated across shipping lanes. The problem is that a thermal cover is not a temperature control system. It is a thermal protection system, and the distinction drives everything about how covers are designed, how they are tested, and how their performance data should be read. Simply put: thermal covers slow heat transfer; they do not control temperature.
What Does a Thermal Cover Actually Do?
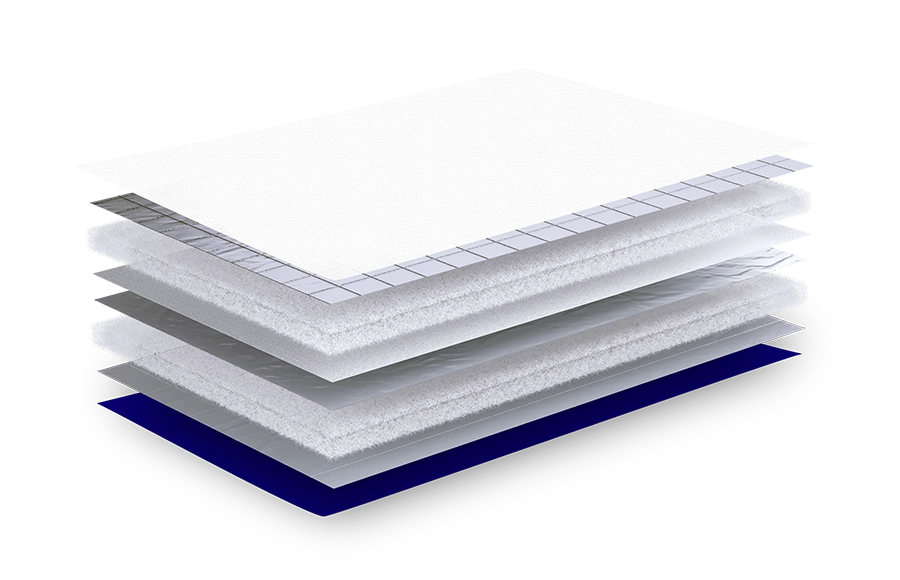
A temperature control system has an energy source. A validated shipper with refrigerant packs or phase change material is continuously working against the ambient environment to maintain a target range across a multi-day journey. A traditional thermal cover has none of that. No refrigerant. No phase change material. No active component at all. What a cover has is insulation, and in better designs, a reflective barrier. Its job is to slow the rate of heat transfer during a break in the cold chain.
Cold chain breaks are measured in hours, not days, and encompass many modes of transport. A truck arrives at the airport ramp and offloads a pallet onto the tarmac, exposed to the environmental elements for up to 4 hours. A container shipment transfers from vessel to dock, the unplugging of power may take up to 12 hours. Each mode of transport introduces a gap with a slightly different hazard. A thermal cover is the barrier between the payload and the threat from uncontrolled ambient exposure. The question it answers is not whether it can maintain a controlled temperature over a 96-hour profile, but whether it can slow heat exchange to protect the product until the next controlled environment.
“As the market evolves and cold chain lanes mature, individuals transitioning from temperature control systems may expect thermal covers to perform identically to passive/active shippers. They do not, although they are nonetheless appropriate for their intended usage. When used in conjunction with a well-controlled cold chain network, a thermal cover provides the ideal balance. The cold chain keeps the temperature stable; the cover just ensures that the product survives the unavoidable, short-lived interruptions in the chain along the way.”
— Paddy O’Hara, Lead Project Engineering, CSafe
How Are Thermal Covers Tested?
Because covers address a different problem, they are qualified against a different kind of risk — one defined by duration and ambient extremes rather than sustained lane conditions.
The primary testing methodology is the static temperature soak test. The protocol exposes the covered payload to a constant ambient extreme — hot or cold — and measures temperature change over time, or more importantly how long the payload temperature remains within acceptable bounds. The temperature profile is a straight line. This is not a simplified test; it precisely replicates the scenario the cover is designed for.
The ramp test addresses a related scenario: what happens when the controlled environment fails progressively? If a reefer truck’s cooling unit breaks down, the internal temperature steadily climbs rather than jumping instantly. The ramp test replicates this with a rising temperature profile, which is particularly relevant when a failure may not be detected immediately.
Direct sunlight testing adds a third dimension. A cover in shade and a cover in direct sun are in very different thermal environments even at the same air temperature. Solar irradiance introduces a secondary layer of energy transfer through visible light that must be managed in much the same way as infra-red heat, and reflective cover designs are specifically engineered to address it.
How Should You Read Thermal Cover Test Data?
Reading a thermal cover test report well requires understanding three elements of context: the delta-T, the ambient test temperature, and the thermal mass of the test payload.
The most important number in a thermal cover test report is not a temperature setpoint but the difference in temperature between the payload and the ambient environment, commonly known as the delta-T. The delta-T dictates the rate of heat transfer: the larger the difference, the faster heat moves. That rate determines the duration — how many hours the payload remains within the acceptable window — which is ultimately what tells you whether the cover fits your application.
Context also includes the ambient test temperature — a cover tested at 38°C and one tested at 43°C are not directly comparable without accounting for the difference. It also includes configuration. Good Distribution Practice (GDP) guidelines can sometimes restrict thermal covers to the sides and top of a pallet, leaving the base unprotected and exposed to the floor surface. Understanding exactly how the cover was configured during testing, and whether that matches deployment, is essential to reading the data accurately.
Thermal mass is one of the most significant variables in this equation. A cover does not generate protection on its own; it works in combination with the thermal mass of the payload it is covering. The more mass, the more thermal inertia the system has, and the longer it resists temperature change. Because of this, test data should always be evaluated in light of the mass it was generated with — results from a fully loaded pallet will not translate directly to a low-mass shipment and applying them as if they do will lead to an under-specified cover selection.
Applying the Right Selection Framework
ISTA 7D was designed by the International Safe Transit Association to validate temperature-controlled packaging against severe, abrupt ambient temperature fluctuations and extreme seasonal conditions over extended periods exceeding 24 hours — the kind of sustained performance that requires an energy source. Applying that standard to a thermal cover asks the wrong question. A cover is not trying to maintain temperature across a lane; it is trying to protect a payload during the hours when the cold chain is broken.
The right framework starts with understanding your break scenarios: the typical durations of cold chain gaps, the ambient extremes at points of exposure, and whether sunlight is a significant factor. Once those are defined, soak test data maps directly to requirements. The supplier questions that matter are: at what ambient was the soak test conducted, does the tested configuration include base protection, was a ramp test performed and at what rate of change, and was reflectivity tested under direct sunlight conditions?
Those questions surface the meaningful differences between products and yield data that can be evaluated against real operational needs. Equally important to the test data, however, are two characteristics of the payload itself: its thermal mass and its acceptable temperature range.
Payload mass is one of the most significant selection variables, and one that is increasingly difficult to generalize as shipping configurations become more varied. A low-mass shipment offers less thermal inertia, which means the cover must work harder to hold back the ambient extreme. This is not a flaw in the cover; it is a selection variable. Lower mass payloads may require a higher performing grade to achieve the same protection window, while high-mass loads may perform adequately with an entry-level solution.
Product stability range is the other half of that selection calculation. A product with a tight acceptable range, say 15 to 25°C, leaves little room for temperature drift during a cold chain break and will typically require a higher grade cover to stay within bounds. A product with a broader range, such as 2 to 40°C, has considerably more tolerance built in, and a lower grade solution may be entirely sufficient. Stability and efficacy data for the product should inform cover selection as directly as the operational break scenarios do.
Protection Is Only Half the Story
There is a dimension of cover selection that performance data alone does not capture: what happens after the break ends and the shipment re-enters the cold chain?
Because the system will return to a controlled environment, the cover’s role does not end at the point of re-entry — it continues to influence how quickly the payload recovers to its target temperature range. A higher grade cover with greater insulation that served the payload well during a hot tarmac exposure may actually slow recovery once the pallet is back in refrigerated storage, because the same insulation that kept heat out now keeps it in. Recovery time matters. An excursion or deviation determination is not based on temperature alone; time at temperature is the critical factor. A payload that spends longer recovering due to an overly insulating cover may accumulate more time outside range than a payload under a lower grade cover that recovers quickly.
This means cover grade selection is a balancing act between protection during the break and recovery efficiency afterward. The right cover is not always the highest performing one. It is the one that fits the full journey — holding back the extreme during the gap, then allowing the cold chain to do its work efficiently once re-established.
Key Takeaways
Thermal covers are thermal protection, not temperature control. They slow heat transfer during cold chain breaks measured in hours; they do not maintain temperature over multi-day journeys. Qualifying them against standards like ISTA 7D asks the wrong question.
Covers are qualified using soak tests (constant ambient), ramp tests (progressively changing ambient), and direct sunlight testing (solar gain). Each replicates a specific cold chain break scenario. The key metric is duration, not a temperature setpoint.
Test results must be read in context: the delta-T (temperature difference between payload and ambient), the test ambient temperature, the thermal mass of the test payload, and whether base protection was included. Results from a fully loaded pallet do not apply directly to a low-mass shipment.
Cover grade selection depends on payload mass, product stability range, break scenario duration, and recovery time after re-entering the cold chain. The highest performing cover is not always the right one. Over-insulation can slow cold chain recovery and increase time-at-temperature excursion risk.
The covers are doing a specific job. The tests replicate that job. The data reports on how well they did it.
Shared knowledge. Better outcomes.
CSafe brings real-world experience to every customer conversation. Speak with a CSafe specialist about your lanes, product profile, and cold chain requirements.